Datasets
Developing data hungry code, e.g. machine learning applications, comes with the burden of creating and maintaining datasets. While creating a dataset might seem to be most of the work, often enough, maintaining it is the hard part.
Our dataset format
We have defined our own labeled dataset format that uses a single .yaml file with
a description of all class ids,
a description of all attributes, and
list of all labels
Example
Let’s consider a small dataset of three images:
tree .
.
├── frame1.png
├── frame2.png
├── frame3.png
└── labels.yaml
The labels.yaml can look like this:
attributes:
- x1
- y1
- x2
- y2
- class_id
classes:
  135: zebra_crossing_sign
  202: CrosswalkLines
labels:
  frame00001.png:
  - - 381
    - 66
    - 436
    - 113
    - 135
  - - -84
    - 135
    - 345
    - 195
    - 202
  frame00002.png: []
  frame00003.png:
  - - 745
    - 67
    - 789
    - 109
    - 135
Why?
Python can easily open and construct classes out of yaml files
Class descriptions are easier to understand than integer IDs
Attributes are accessible in the beginning of each label file
How to open a dataset?
>>> import torch
>>> from kitcar_ml.utils.data.labeled_dataset import LabeledDataset
>>> dataset = LabeledDataset.from_yaml("path/to/label/file")
>>> dataloader = torch.utils.data.DataLoader(
...     dataset,
...     batch_size=2,
...     shuffle=False,
...     num_workers=1,
... )
>>> for i, data in enumerate(dataloader):
...     pass
Our datasets
Here are all datasets we currently have set up and how you can download them.
1. Real images
Old labeled data
On the webdav we have a labeled dataset created for the first traffic sign recognition network.
The dataset has a different format, so we need to convert it first.
With a script you can convert it to our current data format.
But there is also a dvc stage for this conversion.
stages:
  parse_old_labeled_data:
    cmd: |
      python3 -m kitcar_ml.utils.data.import_kitcar_xml_labels --input-dir ../../raw/real/old_labeled_data/ --output-dir old_labeled_data
      python3 -c "from kitcar_ml.utils.data.visual_labeled_dataset import VisualLabeledDataset; vl = VisualLabeledDataset.from_yaml('old_labeled_data/labels.yaml'); vl.create_debug_images('debug',sample_size=50);"
      python3 -c "from kitcar_ml.utils.data.labeled_dataset import LabeledDataset; LabeledDataset.split_file('old_labeled_data/labels.yaml',{'train':0.7,'test':0.2,'val':0.1});"
      python3 -m kitcar_ml.utils.data.analyse_bbox_dataset --label-file "old_labeled_data/labels.yaml" --output-folder "old_labeled_data/analysis"
    deps:
    - ../../../kitcar_ml/utils/data/import_kitcar_xml_labels.py
    - ../../../kitcar_ml/utils/data/visual_labeled_dataset.py
    - ../../../kitcar_ml/utils/data/analyse_bbox_dataset.py
    - ../../../kitcar_ml/utils/data/label_conversion.yaml
    - ../../raw/real/old_labeled_data
    outs:
    - old_labeled_data
  parse_label_studio_data_standard_signs:
    cmd: |
      python3 -m kitcar_ml.utils.data.import_label_studio_labels --annotations-dir ../../raw/real/label_studio_annotations/object_detection_standard_signs --output-dir standard_signs
      python3 -c "from kitcar_ml.utils.data.visual_labeled_dataset import VisualLabeledDataset; vl = VisualLabeledDataset.from_yaml('standard_signs/labels.yaml'); vl.create_debug_images('debug',sample_size=50);"
      python3 -c "from kitcar_ml.utils.data.labeled_dataset import LabeledDataset; LabeledDataset.split_file('standard_signs/labels.yaml',{'train':0.8,'val':0.2});"
      python3 -m kitcar_ml.utils.data.analyse_bbox_dataset --label-file "standard_signs/labels.yaml" --output-folder "standard_signs/analysis"
    deps:
    - ../../../kitcar_ml/utils/data/import_label_studio_labels.py
    - ../../../kitcar_ml/utils/data/visual_labeled_dataset.py
    - ../../../kitcar_ml/utils/data/analyse_bbox_dataset.py
    - ../../raw/real/label_studio_annotations/object_detection_standard_signs/
    outs:
    - standard_signs:
        persist: true
  parse_label_studio_data_speed_limits:
    cmd: |
      python3 -m kitcar_ml.utils.data.import_label_studio_labels --annotations-dir ../../raw/real/label_studio_annotations/object_detection_speed_limits --output-dir speed_limits
      python3 -c "from kitcar_ml.utils.data.visual_labeled_dataset import VisualLabeledDataset; vl = VisualLabeledDataset.from_yaml('speed_limits/labels.yaml'); vl.create_debug_images('debug',sample_size=50);"
      python3 -c "from kitcar_ml.utils.data.labeled_dataset import LabeledDataset; LabeledDataset.split_file('speed_limits/labels.yaml',{'train':0.8,'val':0.2});"
      python3 -m kitcar_ml.utils.data.analyse_bbox_dataset --label-file "speed_limits/labels.yaml" --output-folder "speed_limits/analysis"
    deps:
    - ../../../kitcar_ml/utils/data/import_label_studio_labels.py
    - ../../../kitcar_ml/utils/data/visual_labeled_dataset.py
    - ../../../kitcar_ml/utils/data/analyse_bbox_dataset.py
    - ../../raw/real/label_studio_annotations/object_detection_speed_limits/
    outs:
    - speed_limits:
        persist: true
  parse_label_studio_data_obstacles:
    cmd: |
      python3 -m kitcar_ml.utils.data.import_label_studio_labels --annotations-dir ../../raw/real/label_studio_annotations/object_detection_obstacles --output-dir obstacles
      python3 -c "from kitcar_ml.utils.data.visual_labeled_dataset import VisualLabeledDataset; vl = VisualLabeledDataset.from_yaml('obstacles/labels.yaml'); vl.create_debug_images('debug',sample_size=50);"
      python3 -c "from kitcar_ml.utils.data.labeled_dataset import LabeledDataset; LabeledDataset.split_file('obstacles/labels.yaml',{'train':0.8,'val':0.2});"
      python3 -m kitcar_ml.utils.data.analyse_bbox_dataset --label-file "obstacles/labels.yaml" --output-folder "obstacles/analysis"
    deps:
    - ../../../kitcar_ml/utils/data/import_label_studio_labels.py
    - ../../../kitcar_ml/utils/data/visual_labeled_dataset.py
    - ../../../kitcar_ml/utils/data/analyse_bbox_dataset.py
    - ../../raw/real/label_studio_annotations/object_detection_obstacles/
    outs:
    - obstacles:
        persist: true
You can download and convert the dataset with the following commands:
dvc pull data/raw/real/old_labeled_data.dvc
dvc repro data/pre_processed/real/dvc.yaml
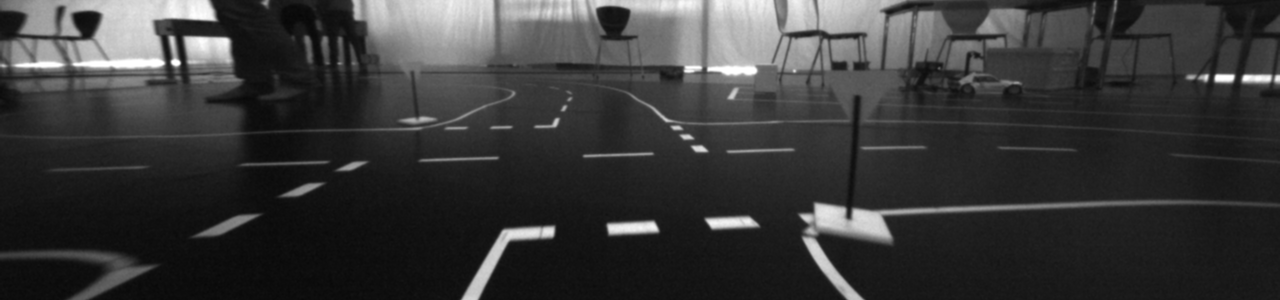
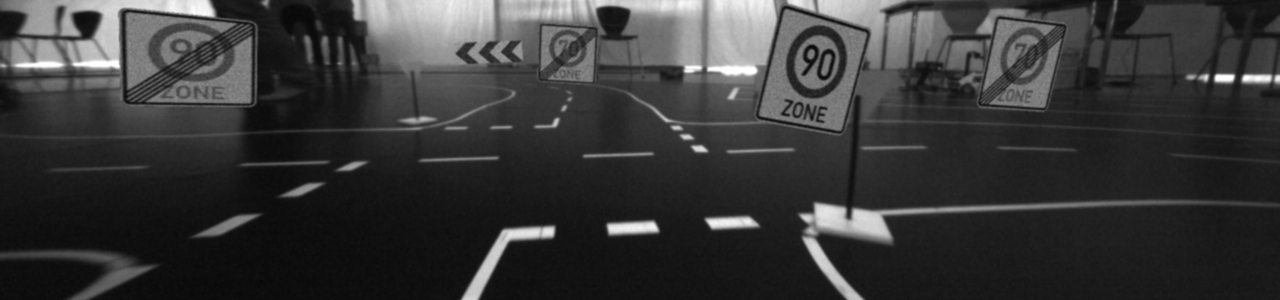
2. Generated images
Somewhere between real and simulated datasets are generated images. They are real images artificially modified to automatically create a dataset. The first generated dataset contains real camera images from our vehicles that are supplemented with images of traffic signs.
The dataset is located at data/pre_processed/real/generated_data. It can be downloaded and/or updated using the following commands:
dvc pull data/pre_processed/real/generated_data
dvc repro data/pre_processed/real/dvc.yaml
The underlying tool can be found in kitcar_ml.utils.data_generation.data_generation_tool.
3. Simulated images
Using DVC we can easily import datasets from our simulation repository.
md5: 174fa7e322a1a970b4f2fed0372eb83e
frozen: true
deps:
- path: data/labeled_images/random_roads
  repo:
    url: git@git.kitcar-team.de:kitcar/kitcar-gazebo-simulation.git
    rev: master
    rev_lock: c275771e37692142a81e8277bd17cc8950ce608c
outs:
- md5: dadb48c84308d367fd53f78541372628.dir
  size: 1134048848
  nfiles: 16926
  path: random_roads
  hash: md5
md5: 454b0cd8128b523b033becec457d90ca
frozen: true
deps:
- path: data/labeled_images/random_roads_gan
  repo:
    url: git@git.kitcar-team.de:kitcar/kitcar-gazebo-simulation.git
    rev: master
    rev_lock: c275771e37692142a81e8277bd17cc8950ce608c
outs:
- md5: f4a8b6547f4b9a128debae6fcec4af69.dir
  size: 815084441
  nfiles: 2771
  path: random_roads_gan
  hash: md5
The dataset contains automatically generated and labeled images from simulated roads. It can be downloaded with the following command:
dvc pull -R data/raw/simulation/labeled_images
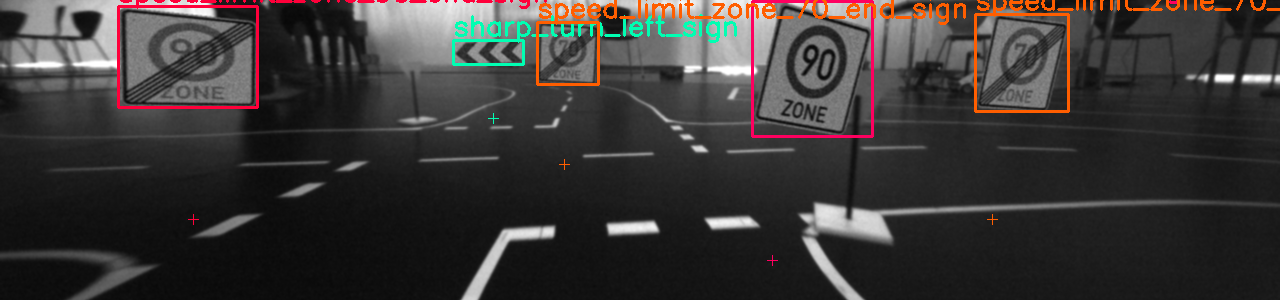
Analyzing Datasets
Dataset Analysis can be done by this tool: kitcar_ml.utils.data.analyse_bbox_dataset.
With this command you could create a detailed report for every bounding box dataset:
python3 -m kitcar_ml.utils.data.analyse_bbox_dataset --label-file LABEL_FILE --output-folder OUTPUT_FOLDER
Report
The analysis tool creates a comprehensive report, which looks something like this:
BBox Dataset Analysis
---------------------

Basic Information

Path to dataset: old_labeled_data
Number of Classes: 23
Number of Bounding Boxes: 6569
Number of Images: 3236
Image Size: (1280, 300)

Detailed Information

  ID  Class Name                      Targets        Width          Height         Aspect Ratio
----  ------------------------------  -------------  -------------  -------------  --------------
   0  pass_right_sign                 376, 5.72 %    29.01 +-20.34  26.22 +-17.8   1.11 +-0.17
   1  zebra_crossing_sign             338, 5.15 %    43.8 +-33.44   43.9 +-32.47   1.02 +-0.25
   2  sharp_turn_left_sign            679, 10.34 %   52.03 +-59.51  23.36 +-23.19  2.3 +-0.68
   3  expressway_start_sign           378, 5.75 %    50.54 +-43.33  47.33 +-40.56  1.08 +-0.24
   4  priority_sign                   152, 2.31 %    29.28 +-18.32  33.59 +-18.66  0.88 +-0.23
   5  oncoming_traffic_sign           136, 2.07 %    37.1 +-36.56   34.38 +-29.82  1.05 +-0.16
   6  parking_sign                    357, 5.43 %    43.78 +-38.8   42.57 +-35.46  1.01 +-0.14
   7  uphill_grade_sign               206, 3.14 %    53.84 +-43.32  45.1 +-33.48   1.16 +-0.16
   8  speed_limit_zone_30_end_sign    333, 5.07 %    42.83 +-47.8   42.15 +-40.17  0.99 +-0.2
   9  yield_sign                      342, 5.21 %    46.75 +-34.78  40.4 +-33.28   1.18 +-0.26
  10  sharp_turn_right_sign           392, 5.97 %    54.6 +-50.7    22.14 +-19.42  2.5 +-0.66
  11  sharp_turn_right_small_sign     390, 5.94 %    28.98 +-26.37  26.5 +-18.92   1.06 +-0.29
  12  turn_right_sign                 244, 3.71 %    44.89 +-33.76  39.64 +-30.32  1.12 +-0.22
  13  downhill_grade_sign             197, 3.0 %     63.84 +-45.81  53.82 +-41.21  1.2 +-0.22
  14  turn_left_sign                  184, 2.8 %     37.8 +-33.22   35.61 +-28.08  1.04 +-0.18
  15  stop_sign                       157, 2.39 %    51.5 +-33.32   51.5 +-35.61   1.03 +-0.16
  16  no_overtaking_end_sign          84, 1.28 %     26.73 +-17.24  31.1 +-23.03   0.9 +-0.12
  17  speed_limit_zone_30_start_sign  207, 3.15 %    49.16 +-56.22  46.25 +-46.01  1.01 +-0.17
  18  sharp_turn_left_small_sign      621, 9.45 %    27.34 +-27.93  26.6 +-23.6    1.02 +-0.21
  19  expressway_end_sign             388, 5.91 %    41.14 +-37.02  40.23 +-33.98  1.02 +-0.18
  20  no_overtaking_start_sign        164, 2.5 %     42.37 +-20.75  43.27 +-31.42  1.05 +-0.26
  21  speed_limit_zone_20_start_sign  125, 1.9 %     61.07 +-53.5   56.74 +-42.93  1.03 +-0.16
  22  speed_limit_zone_20_end_sign    119, 1.81 %    65.92 +-60.24  57.38 +-46.67  1.1 +-0.16
      TOTAL                           6569, 100.0 %  43.49 +-42.05  36.51 +-32.72  1.27 +-0.59
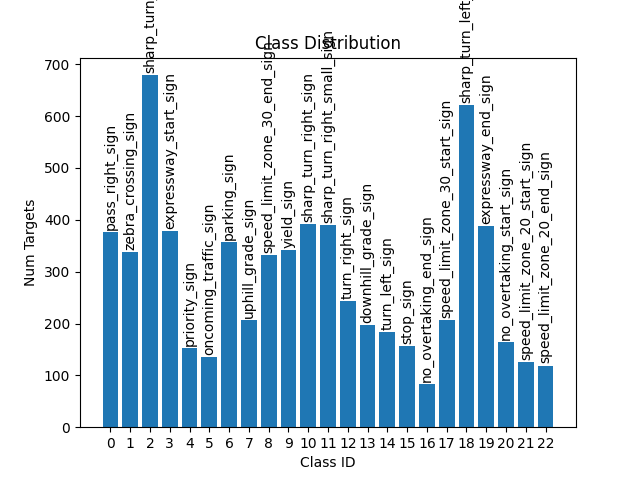
Class Distribution
To analyze the distributions of the classes in the dataset there is the class distribution diagram.
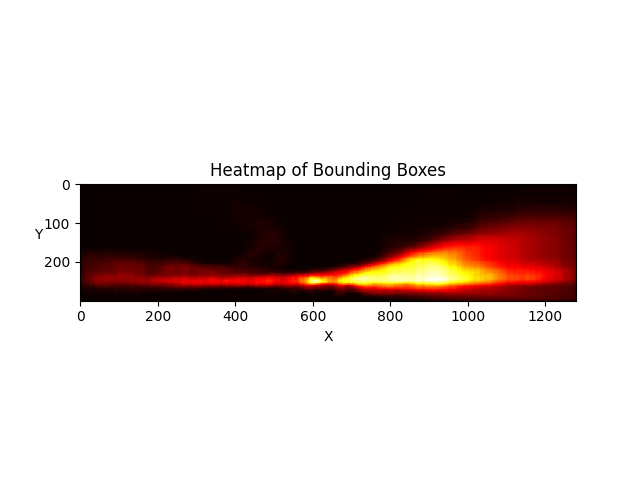
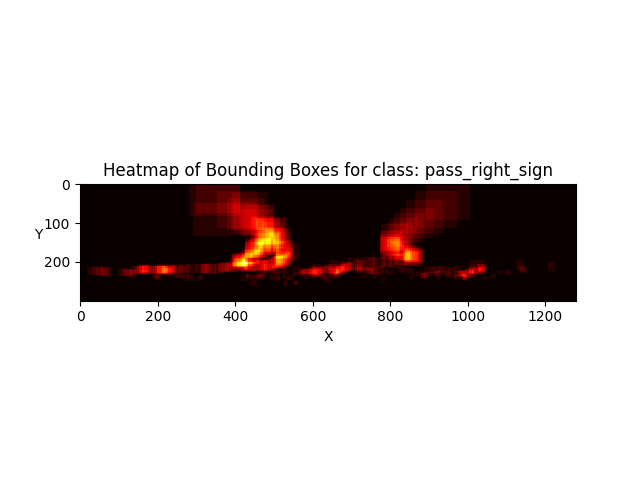
Heatmaps
A heat map visualizes for each point in the image the number of bounding boxes that cover it.